


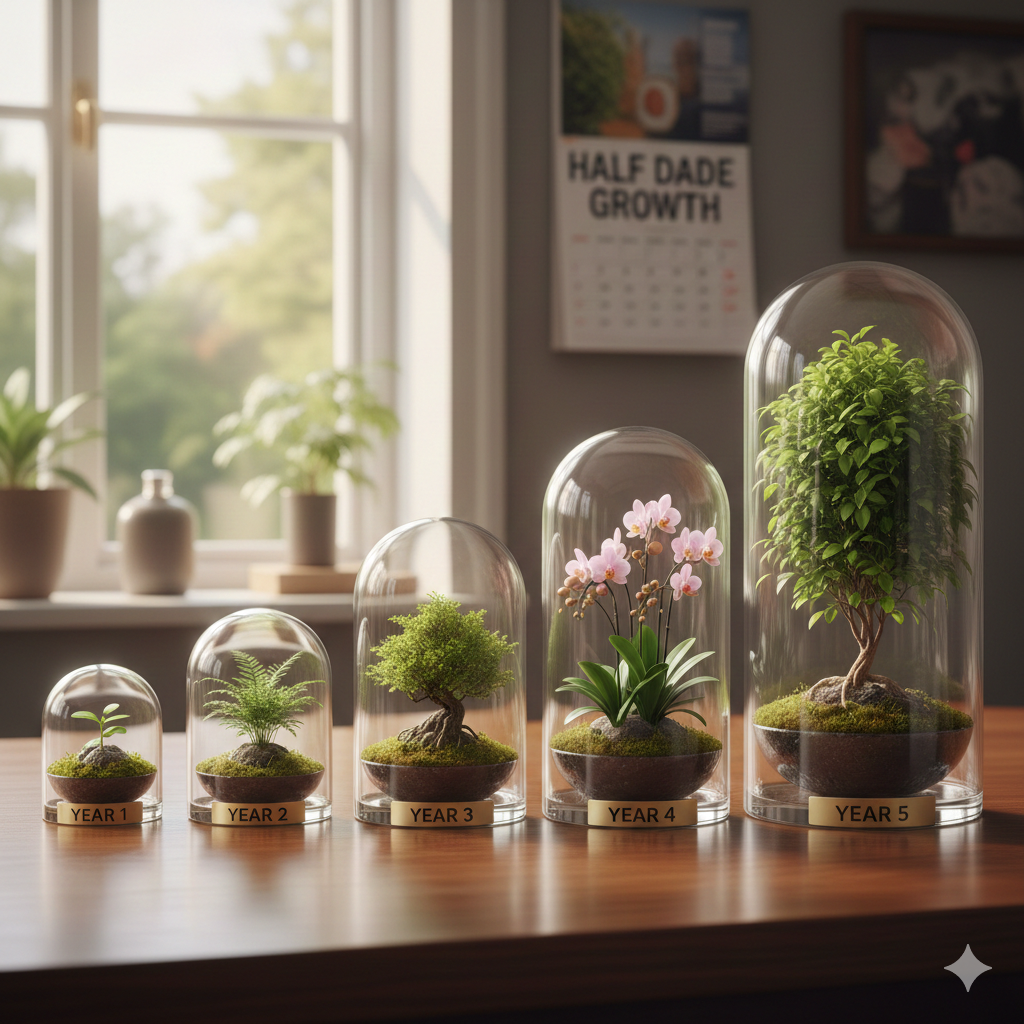
Half Decade Growth
PROPERTY > RESIDENTIAL > Market & Investment > Half Decade Growth
| This index represents the population or development growth in the surrounding area over the past five years, where "1" indicates slower or minimal growth and "3" indicates fast or significant growth. |
📊 Half Decade Growth Index
Topic: Property | Category: Residential | Group: Market & Investment**
Description
The Half Decade Growth Index measures long-term price growth trends for the area surrounding a property.
What the Index Measures
This index tracks:
- 5-year property price growth
- long-term neighborhood development
- stable appreciation patterns
- multi-decade performance indicators
Higher scores = strong long-term growth
Lower scores = weak or declining long-term trends
Numeric Scale & Quality Interpretation
Standard scaling applies.
Examples:
- 19/20 = very strong 5-year growth
- 10/20 = average
- 3/20 = long-term stagnation or decline
Accuracy: Large numeric ranges show subtle historical growth differences.
Why Numeric Scales Matter
Long-term stability is one of the safest investment indicators; numeric scoring simplifies it.
How This Index Saves You Time
No need to check historical graphs — the index summarises decades of market change instantly.
AI Insight Example
“This area sits in the top 12% for decade-long appreciation.”
Subscription Callout
Higher tiers unlock 20–40 year historical modelling.
CTA
➡️ See properties in strong long-term growth markets →