


 Login
Login
FEATURES
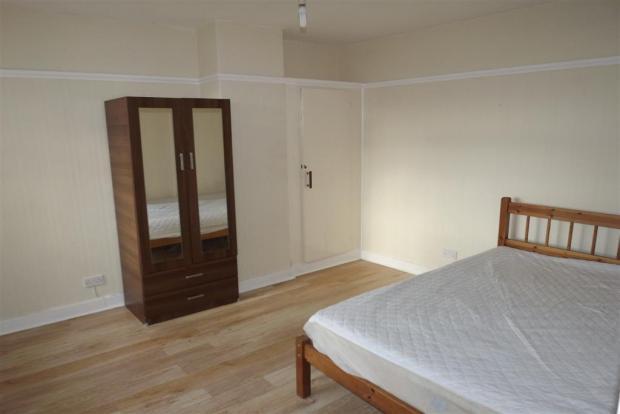
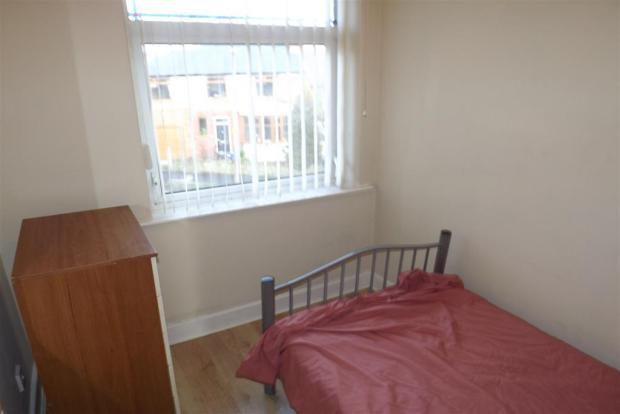
Number of Bedrooms
3
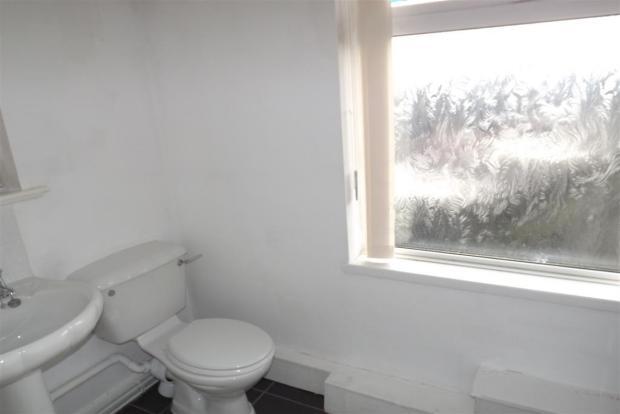
Number of Bathrooms
2
The total Internal Floor Area
110
Buy is Estimated Purchase Value
£350K
Rent is Estimated Rental Value per month
£1.2K
Stay is Estimated cost per night to stay in the property. This is used in websites such as Airbnb, Expedia, booking.com etc
£0
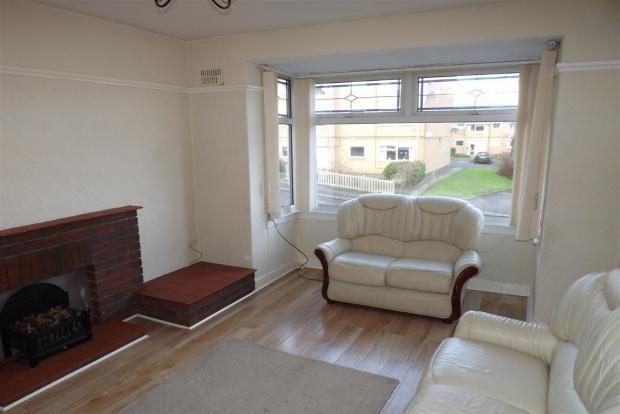
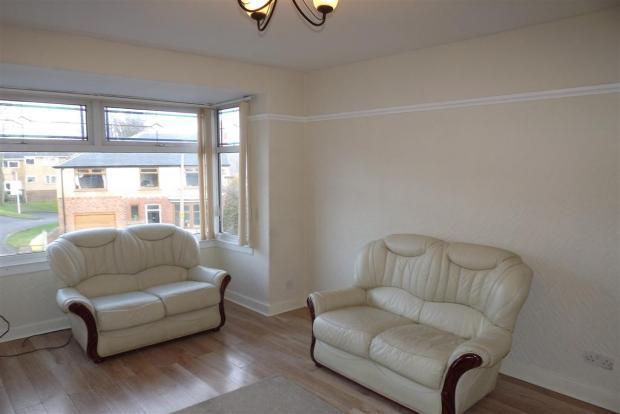
LIVING ROOM

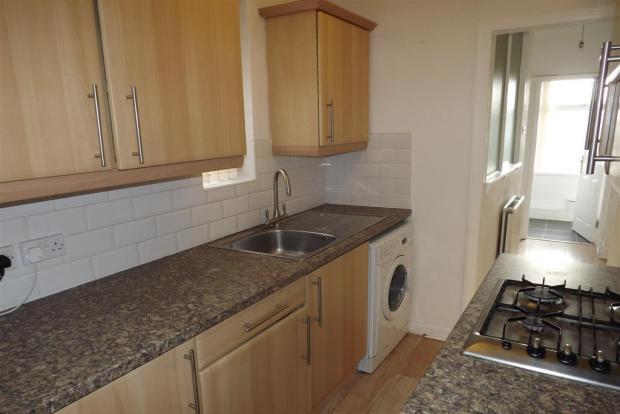
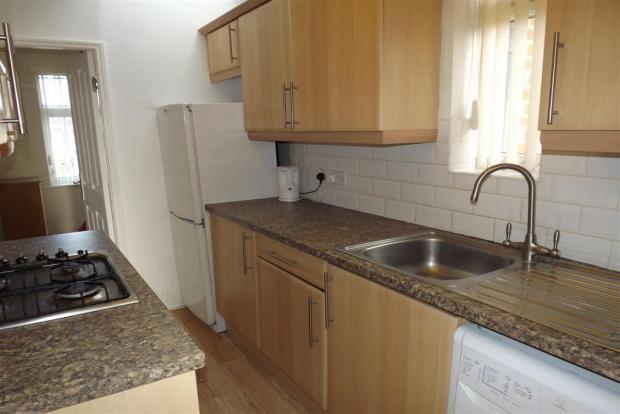
KITCHEN

DINING ROOM

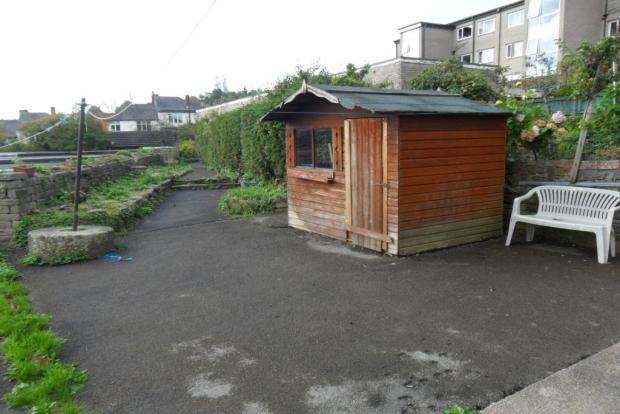
GARDEN

PARKING

BALCONY

SWIMMING POOL

ELEVATOR
Lifestyle & Amenities
The index determines the distance from the property to the nearest Bar, where "1" is the farthest, and "3" is the closest
The index determines the distance from the property to the nearest Cafe, Where "1" is the farthest, and "3" is the closest
Distance from the property to the nearest Convinience Store. Where "1" is the farthest, and "3" is the closest
Distance from the property to the nearest Gym. Where "1" is the farthest, and "3" is the closest
Distance from the property to the nearest Hospital. Where "1" is the farthest, and "3" is the closest
Distance from the property to the nearest Movie Theater. Where "1" is the farthest, and "3" is the closest
Distance from the property to the nearest Nursery. Where "1" is the farthest, and "3" is the closest
Distance from the property to the nearest Park. Where "1" is the farthest, and "3" is the closest
Distance from the property to the nearest Restaurant where "1" is the farthest, and "3" is the closest
Distance from the property to the nearest School where "1" is the farthest, and "3" is the closest
Distance from the property to the nearest Shopping Mall. Where "1" is the farthest, and "3" is the closest
Distance from the property to the nearest Supermarket where "1" is the farthest, and "3" is the closest
Accessibility & Transport
where "1" is the farthest distance from the Airport and "3" the closest distance from the Airport
where "1" is the farthest distance from the Bus Stop and "3" the closest distance from the Bus Stop
where "1" is the farthest distance from the EV Charging Station and "3" the closest distance from the EV Charging Station
where "1" is the farthest distance from the Train Station and "3" the closest distance from the Train Station
where "1" is the farthest distance from the Underground Station and "3" the closest distance from the Underground Station
LOCATION
The altitude of this property is 90 meters above sea level.
This index represents the elevation of the property, where "1" is low altitude and "3" is high altitude.
The internet connectivity around this property is rated 850 out of 1,000.
This index represents the internet signal quality in the area, based on a composite score of nearby mobile and broadband network performance, where "1" indicates weaker connectivity and "3" indicates strong and reliable internet coverage.
The noise level for the property is measured at 55 dB.
This reflects the surrounding sound intensity, where "1" is Quiet and "3" is High noise levels.
Distance from the property to the nearest Bar. Where "1" is the farthest, and "3" is the closest
Distance from the property to the nearest SeaSide where "1" is the farthest, and "3" is the closest
The average temperature around this property is 10°C out of 1,000.
This index represents the average local temperature, where "1" indicates cooler climate and "3" indicates warmer climate.
Social & Community
The average income in this area is 28,000.
This index represents the average income of people living in the surrounding area, where "1" indicates lower income and "3" indicates higher income.
Distance from the property to the nearest Church where "1" is the farthest, and "3" is the closest
Distance from the property to the nearest Community Engagement where "1" is the farthest, and "3" is the closest
Distance from the property to the nearest Education Level where "1" is the farthest, and "3" is the closest
Distance from the property to the nearest Mosque where "1" is the farthest, and "3" is the closest
The population density around this property is 4,500 people per km².
This index represents how densely populated the surrounding area is, where "1" indicates a highly populated area and "3" indicates a sparsely populated area.
Distance from the property to the nearest Synagogue where "1" is the farthest, and "3" is the closest
Property Quality
The property was built in 1,935.
This index represents the Building Age of the property, where "1" is ancient and "3" is new.
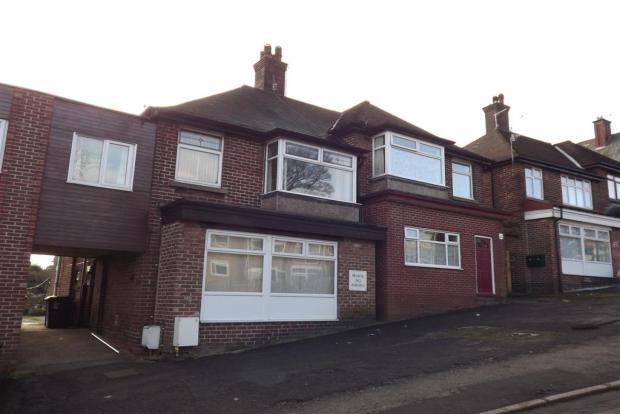
The exterior rating is 700 out of 1,000.
This index measures the Exterior rating out of 1,000, where "1" is low and "3" is high.
The floor area area is 111.0 sq meters.
The index determines the Floor Area area of the property, where"1" is the compact and "3" is the spacious.
The interior rating is 650 out of 1,000.
This index measures the Interior rating out of 1,000, where "1" is low and "3" is high.
The kitchen area is 12.0 sq meters.
The index determines the Kitchen area of the property, where"1" is the compact and "3" is the spacious.
The living room area is 25.0 sq meters.
The index determines the Living Room area of the property, where"1" is the compact and "3" is the spacious.
The site area area is 250.0 sq meters.
The index determines the Site Area area of the property, where"1" is the compact and "3" is the spacious.
The view from this property is rated 600 out of 1,000.
This index represents the overall quality of the surrounding view, where "1" indicates a poor or obstructed view and "3" indicates a scenic or excellent view.
Sustainability & Safety
The air quality in this area is 40 AQI.
This index represents the overall air quality around the property, where "1" indicates poor air quality and "3" indicates good or clean air quality.
The area safety index reflects the crime and security level of the property with a current score of 45.
This index measures the number of crimes per 1000 population, where "1" indicated higher crime risk and "3" is highly safe areas.
The annual energy consumption for the property is 12,000 kWh.
This index reflects the Energy Consumption level based on yearly usage, where "1" is high and "3" is low.
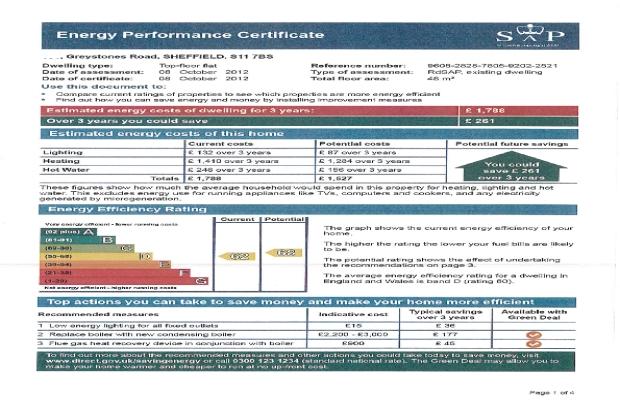
The energy efficiency of the property is 65, based on its EPC score.
This index reflects the property's overall energy performance, where "1" is low and "3" is high.
The property's estimated annual environmental impact is 3,000 kg CO₂ emissions.
This index reflects the environmental footprint derived from energy consumption, where "1" is high and "3" is low CO₂ Emissions.
Distance from the property to the nearest Fire Station. Where "1" is the farthest, and "3" is the closest
Distance from the property to the nearest Petrol Station where "1" is the farthest, and "3" is the closest
Distance from the property to the nearest Police Station. Where "1" is the farthest, and "3" is the closest
Market & Investment
The population or development growth over decades is rated 50.00 out of 1,000.
This index represents the growth rate from one decade to the next in the surrounding area, where "1" indicates slower or minimal growth and "3" indicates fast or significant growth.
The population or development growth over the past five years is rated 22.00 out of 1,000.
This index represents the growth rate from one decade to the next in the surrounding area, where "1" indicates slower or minimal growth and "3" indicates fast or significant growth.
The market liquidity in this area is rated 45 out of 1,000.
This index represents how quickly properties or assets are typically bought or sold in the surrounding area, where "1" indicates slower market activity (longer time to sell) and "3" indicates faster market activity (shorter time to sell).
The price per square meter for properties in this area is 3,167.
This index represents how expensive the area is per square meter, where "1" indicates higher prices and "3" indicates lower prices.
The expected return on investment from potential renovations is 7.
This index represents the potential financial gain from improving or renovating the property, where "1" indicates lower expected returns and "3" indicates higher expected returns.
The property’s undervaluation is 3%.
This index represents how much the property is priced below its estimated market value, where "1" indicates the property is priced close to or above market value and "3" indicates the property is significantly underpriced.
The population or development growth over the past year is rated 4.50 out of 1,000.
This index represents the growth rate from one decade to the next in the surrounding area, where "1" indicates slower or minimal growth and "3" indicates fast or significant growth.
Development & Future Potential
The building’s overall condition is rated 700 out of 1,000.
This index represents the overall physical condition of the property, where "1" indicates poor or deteriorated condition and "3" indicates excellent or well-maintained condition.
The construction ratio (FAR) for this property is 0.44.
This index represents the Floor Area Ratio, calculated as the total built area divided by the land area (floor_area_sqm ÷ site_area_sqm), where "1" indicates a low ratio (less built area relative to land) and "3" indicates a high ratio (more built area relative to land).
The expected return on investment from potential renovations is 12%.
This index represents the potential financial gain from improving or renovating the property, where "1" indicates lower expected returns and "3" indicates higher expected returns.
The average number of approved building permits in this area is 15 per year.
This index represents how active the area is in terms of granted building permits, where "1" indicates low permit activity and "3" indicates high permit activity.
The renovation requirement for this property is 350 out of 1,000.
This index represents how much renovation or repair the property may need, where "1" indicates extensive renovation required and "3" indicates minimal renovation needed.
The zoning flexibility for this property is rated 400 out of 1,000.
This index represents how flexible local zoning rules are for modifying or expanding the property, where "1" indicates strict zoning with limited flexibility and "3" indicates flexible zoning that allows more modifications or expansion.
Comments
RADAR
AD
LOCATION
United Kingdom
Sheffield
S11 7BS
AD
AD
AD
AD
131 Greystones Road
 Sheffield, United Kingdom, S11 7BS
RADAR
FEATURES
Number of Bedrooms
3
Number of Bathrooms
2
The total Internal Floor Area
110
Buy is Estimated Purchase Value
£350K
Rent is Estimated Rental Value per month
£1.2K
Stay is Estimated cost per night to stay in the property. This is used in websites such as Airbnb, Expedia, booking.com etc
£0
LIVING ROOM
KITCHEN
DINING ROOM
GARDEN
PARKING
BALCONY
SWIMMING POOL
ELEVATOR
AD
INDEX
Lifestyle & Amenities
The index determines the distance from the property to the nearest Bar, where "1" is the farthest, and "3" is the closest
The index determines the distance from the property to the nearest Cafe, Where "1" is the farthest, and "3" is the closest
Distance from the property to the nearest Convinience Store. Where "1" is the farthest, and "3" is the closest
Distance from the property to the nearest Gym. Where "1" is the farthest, and "3" is the closest
Distance from the property to the nearest Hospital. Where "1" is the farthest, and "3" is the closest
Distance from the property to the nearest Movie Theater. Where "1" is the farthest, and "3" is the closest
Distance from the property to the nearest Nursery. Where "1" is the farthest, and "3" is the closest
Distance from the property to the nearest Park. Where "1" is the farthest, and "3" is the closest
Distance from the property to the nearest Restaurant where "1" is the farthest, and "3" is the closest
Distance from the property to the nearest School where "1" is the farthest, and "3" is the closest
Distance from the property to the nearest Shopping Mall. Where "1" is the farthest, and "3" is the closest
Distance from the property to the nearest Supermarket where "1" is the farthest, and "3" is the closest
Accessibility & Transport
where "1" is the farthest distance from the Airport and "3" the closest distance from the Airport
where "1" is the farthest distance from the Bus Stop and "3" the closest distance from the Bus Stop
where "1" is the farthest distance from the EV Charging Station and "3" the closest distance from the EV Charging Station
where "1" is the farthest distance from the Train Station and "3" the closest distance from the Train Station
where "1" is the farthest distance from the Underground Station and "3" the closest distance from the Underground Station
LOCATION
The altitude of this property is 90 meters above sea level.
This index represents the elevation of the property, where "1" is low altitude and "3" is high altitude.
The internet connectivity around this property is rated 850 out of 1,000.
This index represents the internet signal quality in the area, based on a composite score of nearby mobile and broadband network performance, where "1" indicates weaker connectivity and "3" indicates strong and reliable internet coverage.
The noise level for the property is measured at 55 dB.
This reflects the surrounding sound intensity, where "1" is Quiet and "3" is High noise levels.
Distance from the property to the nearest Bar. Where "1" is the farthest, and "3" is the closest
Distance from the property to the nearest SeaSide where "1" is the farthest, and "3" is the closest
The average temperature around this property is 10°C out of 1,000.
This index represents the average local temperature, where "1" indicates cooler climate and "3" indicates warmer climate.
Social & Community
The average income in this area is 28,000.
This index represents the average income of people living in the surrounding area, where "1" indicates lower income and "3" indicates higher income.
Distance from the property to the nearest Church where "1" is the farthest, and "3" is the closest
Distance from the property to the nearest Community Engagement where "1" is the farthest, and "3" is the closest
Distance from the property to the nearest Education Level where "1" is the farthest, and "3" is the closest
Distance from the property to the nearest Mosque where "1" is the farthest, and "3" is the closest
The population density around this property is 4,500 people per km².
This index represents how densely populated the surrounding area is, where "1" indicates a highly populated area and "3" indicates a sparsely populated area.
Distance from the property to the nearest Synagogue where "1" is the farthest, and "3" is the closest
Property Quality
The property was built in 1,935.
This index represents the Building Age of the property, where "1" is ancient and "3" is new.
The exterior rating is 700 out of 1,000.
This index measures the Exterior rating out of 1,000, where "1" is low and "3" is high.
The floor area area is 111.0 sq meters.
The index determines the Floor Area area of the property, where"1" is the compact and "3" is the spacious.
The interior rating is 650 out of 1,000.
This index measures the Interior rating out of 1,000, where "1" is low and "3" is high.
The kitchen area is 12.0 sq meters.
The index determines the Kitchen area of the property, where"1" is the compact and "3" is the spacious.
The living room area is 25.0 sq meters.
The index determines the Living Room area of the property, where"1" is the compact and "3" is the spacious.
The site area area is 250.0 sq meters.
The index determines the Site Area area of the property, where"1" is the compact and "3" is the spacious.
The view from this property is rated 600 out of 1,000.
This index represents the overall quality of the surrounding view, where "1" indicates a poor or obstructed view and "3" indicates a scenic or excellent view.
Sustainability & Safety
The air quality in this area is 40 AQI.
This index represents the overall air quality around the property, where "1" indicates poor air quality and "3" indicates good or clean air quality.
The area safety index reflects the crime and security level of the property with a current score of 45.
This index measures the number of crimes per 1000 population, where "1" indicated higher crime risk and "3" is highly safe areas.
The annual energy consumption for the property is 12,000 kWh.
This index reflects the Energy Consumption level based on yearly usage, where "1" is high and "3" is low.
The energy efficiency of the property is 65, based on its EPC score.
This index reflects the property's overall energy performance, where "1" is low and "3" is high.
The property's estimated annual environmental impact is 3,000 kg CO₂ emissions.
This index reflects the environmental footprint derived from energy consumption, where "1" is high and "3" is low CO₂ Emissions.
Distance from the property to the nearest Fire Station. Where "1" is the farthest, and "3" is the closest
Distance from the property to the nearest Petrol Station where "1" is the farthest, and "3" is the closest
Distance from the property to the nearest Police Station. Where "1" is the farthest, and "3" is the closest
Market & Investment
The population or development growth over decades is rated 50.00 out of 1,000.
This index represents the growth rate from one decade to the next in the surrounding area, where "1" indicates slower or minimal growth and "3" indicates fast or significant growth.
The population or development growth over the past five years is rated 22.00 out of 1,000.
This index represents the growth rate from one decade to the next in the surrounding area, where "1" indicates slower or minimal growth and "3" indicates fast or significant growth.
The market liquidity in this area is rated 45 out of 1,000.
This index represents how quickly properties or assets are typically bought or sold in the surrounding area, where "1" indicates slower market activity (longer time to sell) and "3" indicates faster market activity (shorter time to sell).
The price per square meter for properties in this area is 3,167.
This index represents how expensive the area is per square meter, where "1" indicates higher prices and "3" indicates lower prices.
The expected return on investment from potential renovations is 7.
This index represents the potential financial gain from improving or renovating the property, where "1" indicates lower expected returns and "3" indicates higher expected returns.
The property’s undervaluation is 3%.
This index represents how much the property is priced below its estimated market value, where "1" indicates the property is priced close to or above market value and "3" indicates the property is significantly underpriced.
The population or development growth over the past year is rated 4.50 out of 1,000.
This index represents the growth rate from one decade to the next in the surrounding area, where "1" indicates slower or minimal growth and "3" indicates fast or significant growth.
Development & Future Potential
The building’s overall condition is rated 700 out of 1,000.
This index represents the overall physical condition of the property, where "1" indicates poor or deteriorated condition and "3" indicates excellent or well-maintained condition.
The construction ratio (FAR) for this property is 0.44.
This index represents the Floor Area Ratio, calculated as the total built area divided by the land area (floor_area_sqm ÷ site_area_sqm), where "1" indicates a low ratio (less built area relative to land) and "3" indicates a high ratio (more built area relative to land).
The expected return on investment from potential renovations is 12%.
This index represents the potential financial gain from improving or renovating the property, where "1" indicates lower expected returns and "3" indicates higher expected returns.
The average number of approved building permits in this area is 15 per year.
This index represents how active the area is in terms of granted building permits, where "1" indicates low permit activity and "3" indicates high permit activity.
The renovation requirement for this property is 350 out of 1,000.
This index represents how much renovation or repair the property may need, where "1" indicates extensive renovation required and "3" indicates minimal renovation needed.
The zoning flexibility for this property is rated 400 out of 1,000.
This index represents how flexible local zoning rules are for modifying or expanding the property, where "1" indicates strict zoning with limited flexibility and "3" indicates flexible zoning that allows more modifications or expansion.
INDEX