FEATURES
Number of Bedrooms
3
Number of Bathrooms
2
The total Internal Floor Area
120
Buy is Estimated Purchase Value
£45K
Rent is Estimated Rental Value per month
£150
Stay is Estimated cost per night to stay in the property. This is used in websites such as Airbnb, Expedia, booking.com etc
£15
LIVING ROOM

KITCHEN

DINING ROOM

GARDEN

PARKING

BALCONY
SWIMMING POOL

ELEVATOR
Lifestyle & Amenities
The nearest bar is 968 meters from the property.
The index determines the distance from the property to the nearest Bar, where"1" is the farthest and "3" is the closest.
The nearest cafe is 1,721 meters from the property.
The index determines the distance from the property to the nearest Cafe, where"1" is the farthest and "3" is the closest.
The nearest convenience store is 16,850 meters from the property.
The index determines the distance from the property to the nearest Convenience Store, where"1" is the farthest and "3" is the closest.
The nearest gym is 7,365 meters from the property.
The index determines the distance from the property to the nearest Gym, where"1" is the farthest and "3" is the closest.
The nearest hospital is 3,093 meters from the property.
The index determines the distance from the property to the nearest Hospital, where"1" is the farthest and "3" is the closest.
The nearest movie theater is 29,697 meters from the property.
The index determines the distance from the property to the nearest Movie Theater, where"1" is the farthest and "3" is the closest.
The nearest nursery is 5,588 meters from the property.
The index determines the distance from the property to the nearest Nursery, where"1" is the farthest and "3" is the closest.
The nearest park is 10,792 meters from the property.
The index determines the distance from the property to the nearest Park, where"1" is the farthest and "3" is the closest.
The nearest restaurant is 1,210 meters from the property.
The index determines the distance from the property to the nearest Restaurant, where"1" is the farthest and "3" is the closest.
The nearest school is 1,611 meters from the property.
The index determines the distance from the property to the nearest School, where"1" is the farthest and "3" is the closest.
The nearest shopping mall is 2,097 meters from the property.
The index determines the distance from the property to the nearest Shopping Mall, where"1" is the farthest and "3" is the closest.
The nearest super market is 15,497 meters from the property.
The index determines the distance from the property to the nearest Super market, where"1" is the farthest and "3" is the closest.
Accessibility & Transport
The nearest airport is 92,046 meters from the property.
The index determines the distance from the property to the nearest Airport, where"1" is the farthest and "3" is the closest.
The nearest bus stop is 30,501 meters from the property.
The index determines the distance from the property to the nearest Bus Stop, where"1" is the farthest and "3" is the closest.
The nearest ev charging station is 83,083 meters from the property.
The index determines the distance from the property to the nearest EV Charging Station, where"1" is the farthest and "3" is the closest.
where "1" is the farthest distance from the Train Station and "3" the closest distance from the Train Station
where "1" is the farthest distance from the Underground Station and "3" the closest distance from the Underground Station
LOCATION
The altitude of this property is 850 meters above sea level.
This index represents the elevation of the property, where "1" is low altitude and "3" is high altitude.
The average annual humidity level in this area is approximately65%.
This index represents the long-term moisture conditions of the property’s location, where "1" indicates drier air conditions and "3" indicates higher average humidity levels throughout the year.
The internet connectivity around this property is rated 720 out of 1,000.
This index represents the internet signal quality in the area, based on a composite score of nearby mobile and broadband network performance, where "1" indicates weaker connectivity and "3" indicates strong and reliable internet coverage.
The noise level for the property is measured at 55 dB.
This reflects the surrounding sound intensity, where "1" is Quiet and "3" is High noise levels.
The average annual rainfall in this area is approximately 1,500 mm.
This index represents the long-term precipitation conditions of the property’s location, where "1" indicates lower annual rainfall and "3" indicates higher yearly precipitation levels.
The nearest riverside is 71,592 meters from the property.
The index determines the distance from the property to the nearest Riverside, where"1" is the farthest and "3" is the closest.
Distance from the property to the nearest SeaSide where "1" is the farthest, and "3" is the closest
The average temperature around this property is 18°C.
This index represents the average local temperature, where "1" indicates cooler climate and "3" indicates warmer climate.
The average annual wind speed in this area is approximately 12 km/h.
This index represents the long-term wind conditions of the property’s location, where "1" indicates calmer wind conditions and "3" indicates stronger average winds throughout the year.
Social & Community
The average income in this area is £1,200.
This index represents the average income of people living in the surrounding area, where "1" indicates lower income and "3" indicates higher income.
The nearest church is 19,852 meters from the property.
The index determines the distance from the property to the nearest Church, where"1" is the farthest and "3" is the closest.
This index reflects how socially active, connected, and community-driven the local area is, where "1" indicates lower levels of community involvement and social interaction and "3" indicates a highly engaged community with strong participation in local events, groups, and social activities.
The Education Level Index for this area is rated 8 out of 1,000.
This index represents the overall educational attainment of the surrounding community, where "1" indicates lower educational attainment and "3" indicates a more highly educated population.
The nearest mosque is 23,074 meters from the property.
The index determines the distance from the property to the nearest Mosque, where"1" is the farthest and "3" is the closest.
The population density around this property is 350 people per km².
This index represents how densely populated the surrounding area is, where "1" indicates a highly populated area and "3" indicates a sparsely populated area.
The nearest synagogue is 59,365 meters from the property.
The index determines the distance from the property to the nearest Synagogue, where"1" is the farthest and "3" is the closest.
The nearest temple is 3,198 meters from the property.
The index determines the distance from the property to the nearest Temple, where"1" is the farthest and "3" is the closest.
Property Quality
The exterior rating is 700 out of 1,000.
This index measures the Exterior rating out of 1,000, where "1" is low and "3" is high.
The floor area area is 121.0 sq meters.
The index determines the Floor Area area of the property, where"1" is the compact and "3" is the spacious.
The interior rating is 600 out of 1,000.
This index measures the Interior rating out of 1,000, where "1" is low and "3" is high.
The kitchen size area is 12.0 sq meters.
The index determines the Kitchen Size area of the property, where"1" is the compact and "3" is the spacious.
The living room size area is 25.0 sq meters.
The index determines the Living Room Size area of the property, where"1" is the compact and "3" is the spacious.
The site area area is 180.0 sq meters.
The index determines the Site Area area of the property, where"1" is the compact and "3" is the spacious.
The view from this property is rated 650 out of 1,000.
This index represents the overall quality of the surrounding view, where "1" indicates a poor or obstructed view and "3" indicates a scenic or excellent view.
Sustainability & Safety
The air quality in this area is 75 AQI.
This index represents the overall air quality around the property, where "1" indicates poor air quality and "3" indicates good or clean air quality.
The area safety index reflects the crime and security level of the property with a current score of 12.
This index measures the number of crimes per 1000 population, where "1" indicated higher crime risk and "3" is highly safe areas.
The annual energy consumption for the property is 3,500 kWh.
This index reflects the Energy Consumption level based on yearly usage, where "1" is high and "3" is low.
The energy efficiency of the property is 450, based on its EPC score.
This index reflects the property's overall energy performance, where "1" is low and "3" is high.
The property's estimated annual environmental impact is 1,750 kg CO₂ emissions.
This index reflects the environmental footprint derived from energy consumption, where "1" is high and "3" is low CO₂ Emissions.
The nearest fire station is 7,396 meters from the property.
The index determines the distance from the property to the nearest Fire Station, where"1" is the farthest and "3" is the closest.
The nearest petrol station is 12,266 meters from the property.
The index determines the distance from the property to the nearest Petrol Station, where"1" is the farthest and "3" is the closest.
The nearest police station is 5,512 meters from the property.
The index determines the distance from the property to the nearest Police Station, where"1" is the farthest and "3" is the closest.
Market & Investment
The population or development growth over decades is rated 40.00 out of 1,000.
This index represents the growth rate from one decade to the next in the surrounding area, where "1" indicates slower or minimal growth and "3" indicates fast or significant growth.
The population or development growth over the past five years is rated 18.20 out of 1,000.
This index represents the growth rate from one decade to the next in the surrounding area, where "1" indicates slower or minimal growth and "3" indicates fast or significant growth.
The market liquidity in this area is rated 90.00 out of 1,000.
This index represents how quickly properties or assets are typically bought or sold in the surrounding area, where "1" indicates slower market activity (longer time to sell) and "3" indicates faster market activity (shorter time to sell).
The price per square meter for properties in this area is 373.
This index represents how expensive the area is per square meter, where "1" indicates higher prices and "3" indicates lower prices.
The expected return on investment from potential renovations is 8.
This index represents the potential financial gain from improving or renovating the property, where "1" indicates lower expected returns and "3" indicates higher expected returns.
The property’s undervaluation is 5%.
This index represents how much the property is priced below its estimated market value, where "1" indicates the property is priced close to or above market value and "3" indicates the property is significantly underpriced.
The population or development growth over the past year is rated 3.50 out of 1,000.
This index represents the growth rate from one decade to the next in the surrounding area, where "1" indicates slower or minimal growth and "3" indicates fast or significant growth.
Development & Future Potential
The building’s overall condition is rated 650 out of 1,000.
This index represents the overall physical condition of the property, where "1" indicates poor or deteriorated condition and "3" indicates excellent or well-maintained condition.
The construction ratio (FAR) for this property is 0.67.
This index represents the Floor Area Ratio, calculated as the total built area divided by the land area (floor_area_sqm ÷ site_area_sqm), where "1" indicates a low ratio (less built area relative to land) and "3" indicates a high ratio (more built area relative to land).
The expected return on investment from potential renovations is 12%.
This index represents the potential financial gain from improving or renovating the property, where "1" indicates lower expected returns and "3" indicates higher expected returns.
The average number of approved building permits in this area is 15 per year.
This index represents how active the area is in terms of granted building permits, where "1" indicates low permit activity and "3" indicates high permit activity.
The renovation requirement for this property is 300 out of 1,000.
This index represents how much renovation or repair the property may need, where "1" indicates extensive renovation required and "3" indicates minimal renovation needed.
The zoning flexibility for this property is rated 400 out of 1,000.
This index represents how flexible local zoning rules are for modifying or expanding the property, where "1" indicates strict zoning with limited flexibility and "3" indicates flexible zoning that allows more modifications or expansion.
Comments
RADAR
LOCATION
India
Overall score of 60 out of 100
Reason: India offers improving infrastructure, vibrant economy, and diverse housing, but faces challenges in pollution, public services, and healthcare accessibility. Safety and stability vary regionally. Overall, residential quality is average with significant urban-rural disparities.
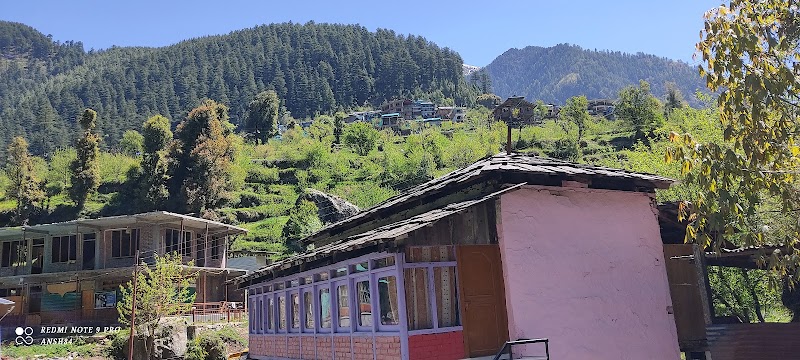
Mandi
Overall score of 56 out of 100
Reason: Mandi benefits from scenic environment and cultural heritage but has limited transport infrastructure, healthcare, and economic opportunities, resulting in moderate residential quality with room for improvement in safety and education.
Mandi City Centre
Overall score of Neighbourhood is 58 out of 100
Reason: Mandi City Centre offers moderate safety and accessibility with basic amenities and reasonable connectivity. However, limited prestige, architectural consistency, and green spaces reduce overall residential quality in this semi-urban area.
26 National Highway 305
 Mandi, India, 175123
RADAR
FEATURES
Number of Bedrooms
3
Number of Bathrooms
2
The total Internal Floor Area
120
Buy is Estimated Purchase Value
£45K
Rent is Estimated Rental Value per month
£150
Stay is Estimated cost per night to stay in the property. This is used in websites such as Airbnb, Expedia, booking.com etc
£15
LIVING ROOM
KITCHEN
DINING ROOM
GARDEN
PARKING
BALCONY
SWIMMING POOL
ELEVATOR
INDEX
Lifestyle & Amenities
The nearest bar is 968 meters from the property.
The index determines the distance from the property to the nearest Bar, where"1" is the farthest and "3" is the closest.
The nearest cafe is 1,721 meters from the property.
The index determines the distance from the property to the nearest Cafe, where"1" is the farthest and "3" is the closest.
The nearest convenience store is 16,850 meters from the property.
The index determines the distance from the property to the nearest Convenience Store, where"1" is the farthest and "3" is the closest.
The nearest gym is 7,365 meters from the property.
The index determines the distance from the property to the nearest Gym, where"1" is the farthest and "3" is the closest.
The nearest hospital is 3,093 meters from the property.
The index determines the distance from the property to the nearest Hospital, where"1" is the farthest and "3" is the closest.
The nearest movie theater is 29,697 meters from the property.
The index determines the distance from the property to the nearest Movie Theater, where"1" is the farthest and "3" is the closest.
The nearest nursery is 5,588 meters from the property.
The index determines the distance from the property to the nearest Nursery, where"1" is the farthest and "3" is the closest.
The nearest park is 10,792 meters from the property.
The index determines the distance from the property to the nearest Park, where"1" is the farthest and "3" is the closest.
The nearest restaurant is 1,210 meters from the property.
The index determines the distance from the property to the nearest Restaurant, where"1" is the farthest and "3" is the closest.
The nearest school is 1,611 meters from the property.
The index determines the distance from the property to the nearest School, where"1" is the farthest and "3" is the closest.
The nearest shopping mall is 2,097 meters from the property.
The index determines the distance from the property to the nearest Shopping Mall, where"1" is the farthest and "3" is the closest.
The nearest super market is 15,497 meters from the property.
The index determines the distance from the property to the nearest Super market, where"1" is the farthest and "3" is the closest.
Accessibility & Transport
The nearest airport is 92,046 meters from the property.
The index determines the distance from the property to the nearest Airport, where"1" is the farthest and "3" is the closest.
The nearest bus stop is 30,501 meters from the property.
The index determines the distance from the property to the nearest Bus Stop, where"1" is the farthest and "3" is the closest.
The nearest ev charging station is 83,083 meters from the property.
The index determines the distance from the property to the nearest EV Charging Station, where"1" is the farthest and "3" is the closest.
where "1" is the farthest distance from the Train Station and "3" the closest distance from the Train Station
where "1" is the farthest distance from the Underground Station and "3" the closest distance from the Underground Station
LOCATION
The altitude of this property is 850 meters above sea level.
This index represents the elevation of the property, where "1" is low altitude and "3" is high altitude.
The average annual humidity level in this area is approximately65%.
This index represents the long-term moisture conditions of the property’s location, where "1" indicates drier air conditions and "3" indicates higher average humidity levels throughout the year.
The internet connectivity around this property is rated 720 out of 1,000.
This index represents the internet signal quality in the area, based on a composite score of nearby mobile and broadband network performance, where "1" indicates weaker connectivity and "3" indicates strong and reliable internet coverage.
The noise level for the property is measured at 55 dB.
This reflects the surrounding sound intensity, where "1" is Quiet and "3" is High noise levels.
The average annual rainfall in this area is approximately 1,500 mm.
This index represents the long-term precipitation conditions of the property’s location, where "1" indicates lower annual rainfall and "3" indicates higher yearly precipitation levels.
The nearest riverside is 71,592 meters from the property.
The index determines the distance from the property to the nearest Riverside, where"1" is the farthest and "3" is the closest.
Distance from the property to the nearest SeaSide where "1" is the farthest, and "3" is the closest
The average temperature around this property is 18°C.
This index represents the average local temperature, where "1" indicates cooler climate and "3" indicates warmer climate.
The average annual wind speed in this area is approximately 12 km/h.
This index represents the long-term wind conditions of the property’s location, where "1" indicates calmer wind conditions and "3" indicates stronger average winds throughout the year.
Social & Community
The average income in this area is £1,200.
This index represents the average income of people living in the surrounding area, where "1" indicates lower income and "3" indicates higher income.
The nearest church is 19,852 meters from the property.
The index determines the distance from the property to the nearest Church, where"1" is the farthest and "3" is the closest.
This index reflects how socially active, connected, and community-driven the local area is, where "1" indicates lower levels of community involvement and social interaction and "3" indicates a highly engaged community with strong participation in local events, groups, and social activities.
The Education Level Index for this area is rated 8 out of 1,000.
This index represents the overall educational attainment of the surrounding community, where "1" indicates lower educational attainment and "3" indicates a more highly educated population.
The nearest mosque is 23,074 meters from the property.
The index determines the distance from the property to the nearest Mosque, where"1" is the farthest and "3" is the closest.
The population density around this property is 350 people per km².
This index represents how densely populated the surrounding area is, where "1" indicates a highly populated area and "3" indicates a sparsely populated area.
The nearest synagogue is 59,365 meters from the property.
The index determines the distance from the property to the nearest Synagogue, where"1" is the farthest and "3" is the closest.
The nearest temple is 3,198 meters from the property.
The index determines the distance from the property to the nearest Temple, where"1" is the farthest and "3" is the closest.
Property Quality
The exterior rating is 700 out of 1,000.
This index measures the Exterior rating out of 1,000, where "1" is low and "3" is high.
The floor area area is 121.0 sq meters.
The index determines the Floor Area area of the property, where"1" is the compact and "3" is the spacious.
The interior rating is 600 out of 1,000.
This index measures the Interior rating out of 1,000, where "1" is low and "3" is high.
The kitchen size area is 12.0 sq meters.
The index determines the Kitchen Size area of the property, where"1" is the compact and "3" is the spacious.
The living room size area is 25.0 sq meters.
The index determines the Living Room Size area of the property, where"1" is the compact and "3" is the spacious.
The site area area is 180.0 sq meters.
The index determines the Site Area area of the property, where"1" is the compact and "3" is the spacious.
The view from this property is rated 650 out of 1,000.
This index represents the overall quality of the surrounding view, where "1" indicates a poor or obstructed view and "3" indicates a scenic or excellent view.
Sustainability & Safety
The air quality in this area is 75 AQI.
This index represents the overall air quality around the property, where "1" indicates poor air quality and "3" indicates good or clean air quality.
The area safety index reflects the crime and security level of the property with a current score of 12.
This index measures the number of crimes per 1000 population, where "1" indicated higher crime risk and "3" is highly safe areas.
The annual energy consumption for the property is 3,500 kWh.
This index reflects the Energy Consumption level based on yearly usage, where "1" is high and "3" is low.
The energy efficiency of the property is 450, based on its EPC score.
This index reflects the property's overall energy performance, where "1" is low and "3" is high.
The property's estimated annual environmental impact is 1,750 kg CO₂ emissions.
This index reflects the environmental footprint derived from energy consumption, where "1" is high and "3" is low CO₂ Emissions.
The nearest fire station is 7,396 meters from the property.
The index determines the distance from the property to the nearest Fire Station, where"1" is the farthest and "3" is the closest.
The nearest petrol station is 12,266 meters from the property.
The index determines the distance from the property to the nearest Petrol Station, where"1" is the farthest and "3" is the closest.
The nearest police station is 5,512 meters from the property.
The index determines the distance from the property to the nearest Police Station, where"1" is the farthest and "3" is the closest.
Market & Investment
The population or development growth over decades is rated 40.00 out of 1,000.
This index represents the growth rate from one decade to the next in the surrounding area, where "1" indicates slower or minimal growth and "3" indicates fast or significant growth.
The population or development growth over the past five years is rated 18.20 out of 1,000.
This index represents the growth rate from one decade to the next in the surrounding area, where "1" indicates slower or minimal growth and "3" indicates fast or significant growth.
The market liquidity in this area is rated 90.00 out of 1,000.
This index represents how quickly properties or assets are typically bought or sold in the surrounding area, where "1" indicates slower market activity (longer time to sell) and "3" indicates faster market activity (shorter time to sell).
The price per square meter for properties in this area is 373.
This index represents how expensive the area is per square meter, where "1" indicates higher prices and "3" indicates lower prices.
The expected return on investment from potential renovations is 8.
This index represents the potential financial gain from improving or renovating the property, where "1" indicates lower expected returns and "3" indicates higher expected returns.
The property’s undervaluation is 5%.
This index represents how much the property is priced below its estimated market value, where "1" indicates the property is priced close to or above market value and "3" indicates the property is significantly underpriced.
The population or development growth over the past year is rated 3.50 out of 1,000.
This index represents the growth rate from one decade to the next in the surrounding area, where "1" indicates slower or minimal growth and "3" indicates fast or significant growth.
Development & Future Potential
The building’s overall condition is rated 650 out of 1,000.
This index represents the overall physical condition of the property, where "1" indicates poor or deteriorated condition and "3" indicates excellent or well-maintained condition.
The construction ratio (FAR) for this property is 0.67.
This index represents the Floor Area Ratio, calculated as the total built area divided by the land area (floor_area_sqm ÷ site_area_sqm), where "1" indicates a low ratio (less built area relative to land) and "3" indicates a high ratio (more built area relative to land).
The expected return on investment from potential renovations is 12%.
This index represents the potential financial gain from improving or renovating the property, where "1" indicates lower expected returns and "3" indicates higher expected returns.
The average number of approved building permits in this area is 15 per year.
This index represents how active the area is in terms of granted building permits, where "1" indicates low permit activity and "3" indicates high permit activity.
The renovation requirement for this property is 300 out of 1,000.
This index represents how much renovation or repair the property may need, where "1" indicates extensive renovation required and "3" indicates minimal renovation needed.
The zoning flexibility for this property is rated 400 out of 1,000.
This index represents how flexible local zoning rules are for modifying or expanding the property, where "1" indicates strict zoning with limited flexibility and "3" indicates flexible zoning that allows more modifications or expansion.
LOCATION
India
Overall score of 60 out of 100
Reason: India offers improving infrastructure, vibrant economy, and diverse housing, but faces challenges in pollution, public services, and healthcare accessibility. Safety and stability vary regionally. Overall, residential quality is average with significant urban-rural disparities.
Mandi
Overall score of 56 out of 100
Reason: Mandi benefits from scenic environment and cultural heritage but has limited transport infrastructure, healthcare, and economic opportunities, resulting in moderate residential quality with room for improvement in safety and education.
Mandi City Centre
Overall score of Neighbourhood is 58 out of 100
Reason: Mandi City Centre offers moderate safety and accessibility with basic amenities and reasonable connectivity. However, limited prestige, architectural consistency, and green spaces reduce overall residential quality in this semi-urban area.
INDEX