


 Login
Login
FEATURES
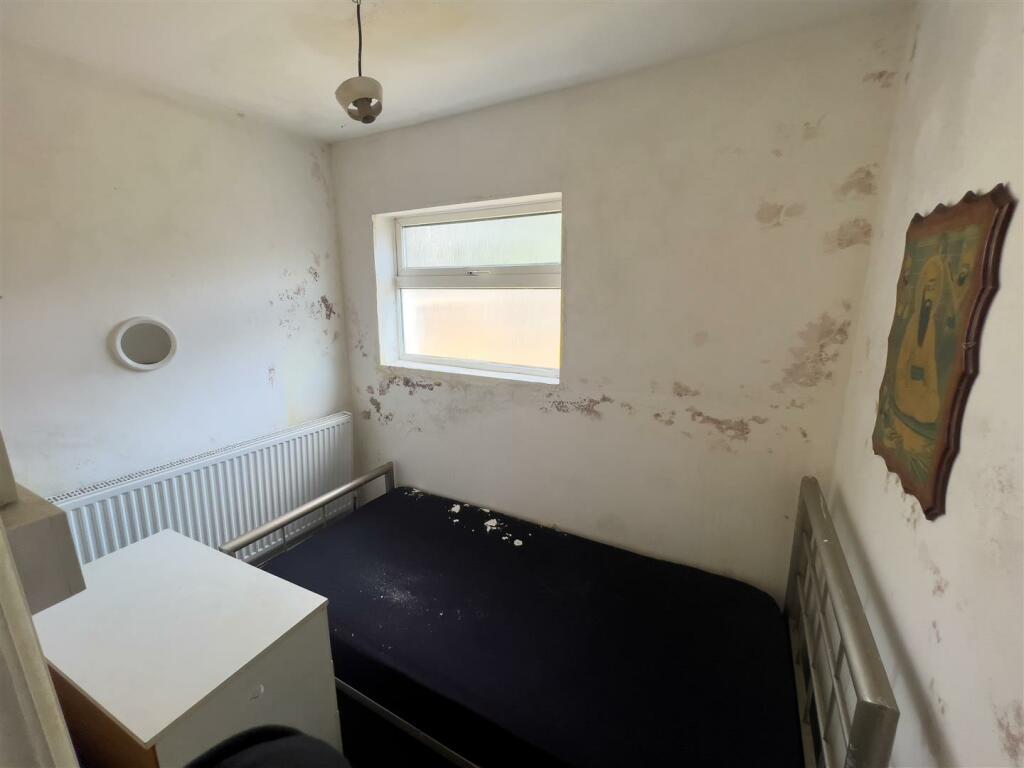
Number of Bedrooms
3
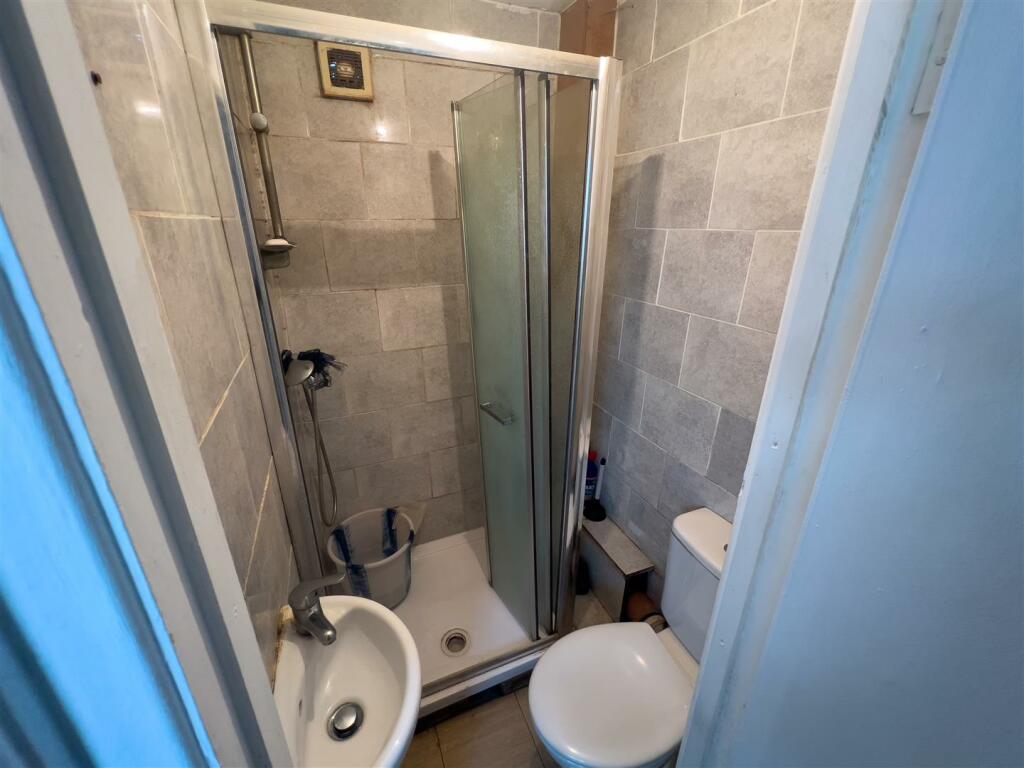
Number of Bathrooms
1
The total Internal Floor Area
85
Buy is Estimated Purchase Value
£375K
Rent is Estimated Rental Value per month
£1.3K
Stay is Estimated cost per night to stay in the property. This is used in websites such as Airbnb, Expedia, booking.com etc
£0
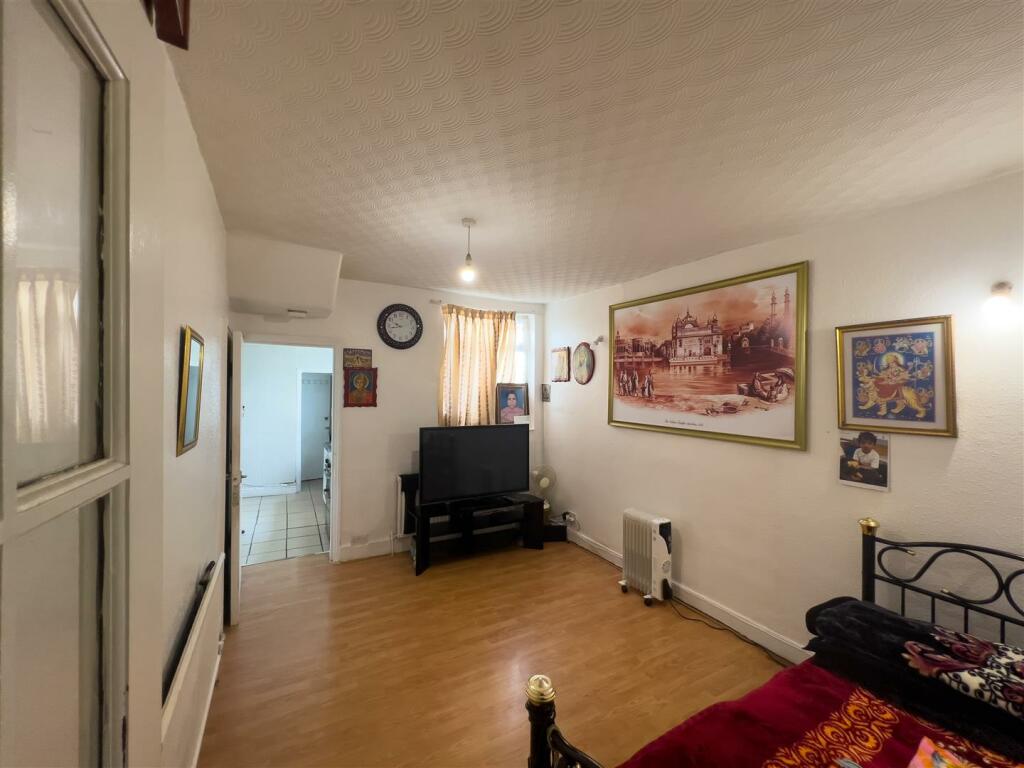
LIVING ROOM

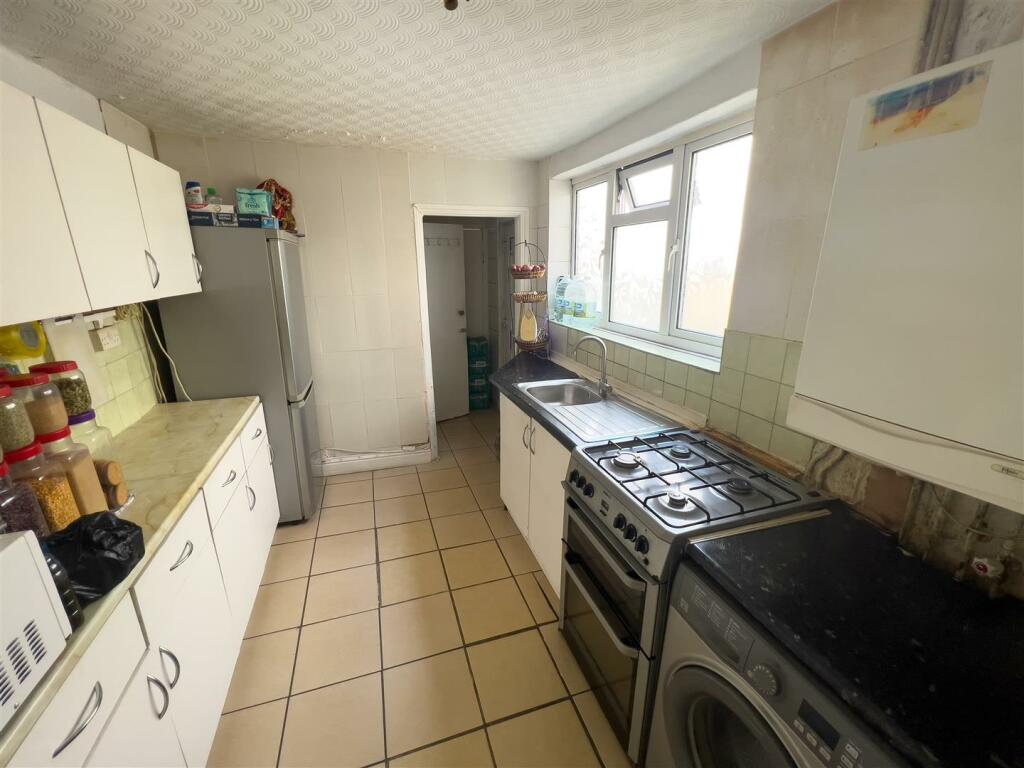
KITCHEN

DINING ROOM

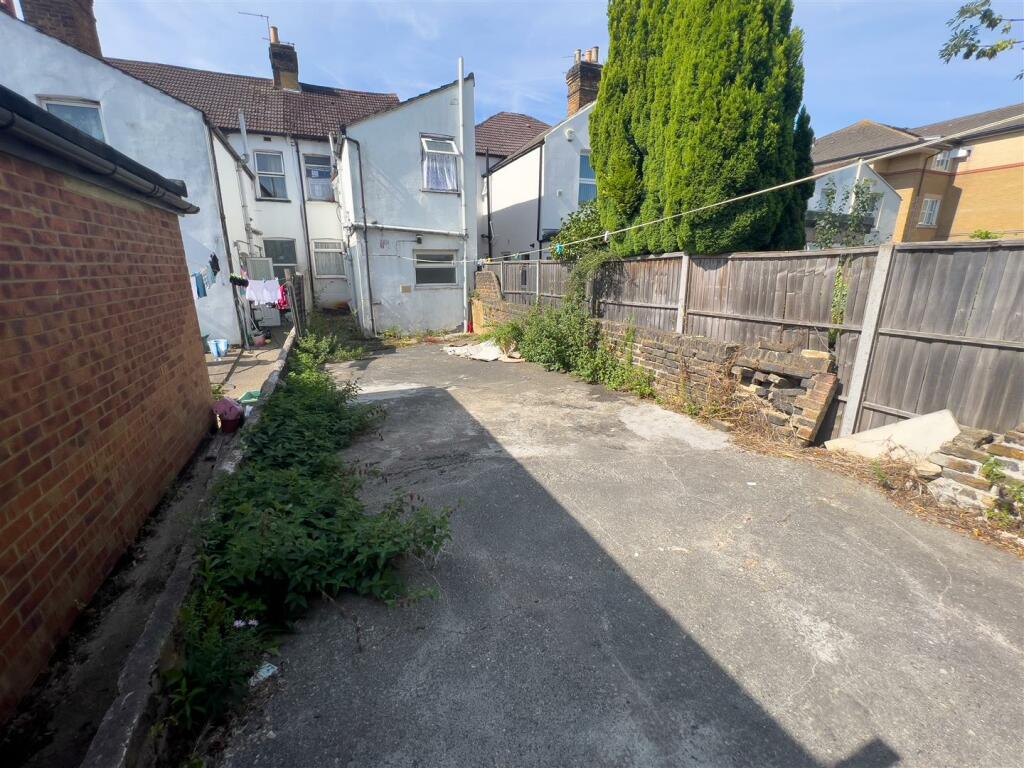
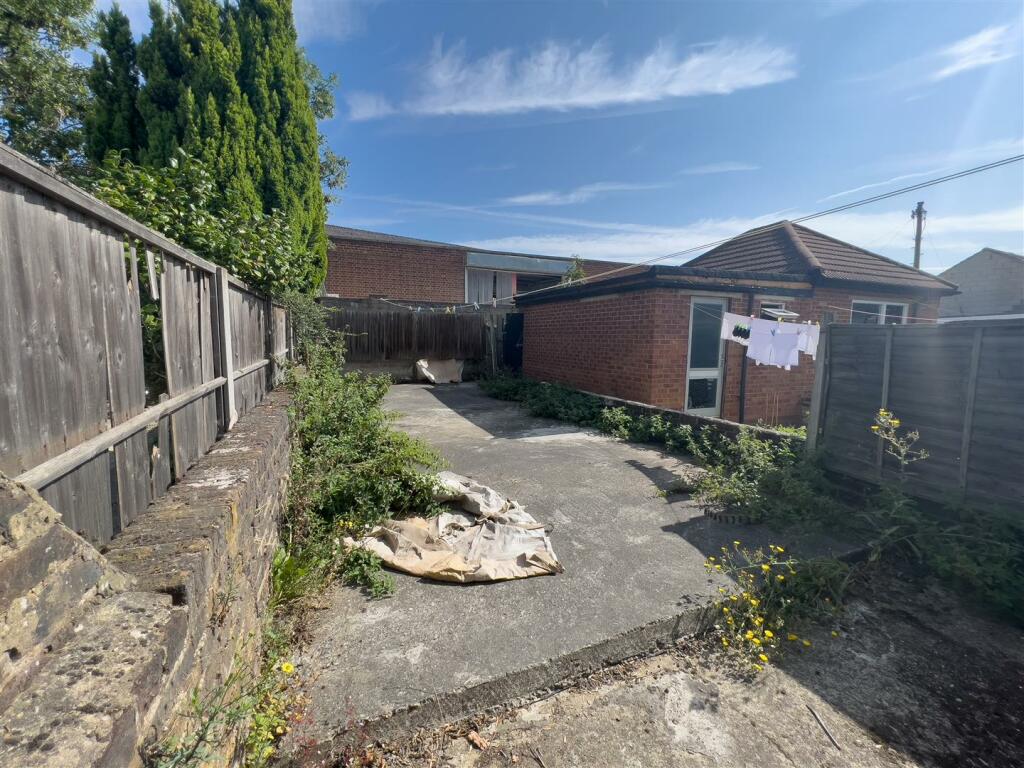
GARDEN

PARKING

BALCONY

SWIMMING POOL

ELEVATOR
Lifestyle & Amenities
The index determines the distance from the property to the nearest Bar, where "1" is the farthest, and "3" is the closest
The index determines the distance from the property to the nearest Cafe, Where "1" is the farthest, and "3" is the closest
Distance from the property to the nearest Convinience Store. Where "1" is the farthest, and "3" is the closest
Distance from the property to the nearest Gym. Where "1" is the farthest, and "3" is the closest
Distance from the property to the nearest Hospital. Where "1" is the farthest, and "3" is the closest
Distance from the property to the nearest Movie Theater. Where "1" is the farthest, and "3" is the closest
Distance from the property to the nearest Nursery. Where "1" is the farthest, and "3" is the closest
Distance from the property to the nearest Park. Where "1" is the farthest, and "3" is the closest
Distance from the property to the nearest Restaurant where "1" is the farthest, and "3" is the closest
Distance from the property to the nearest School where "1" is the farthest, and "3" is the closest
Distance from the property to the nearest Shopping Mall. Where "1" is the farthest, and "3" is the closest
Distance from the property to the nearest Supermarket where "1" is the farthest, and "3" is the closest
Accessibility & Transport
where "1" is the farthest distance from the Airport and "3" the closest distance from the Airport
where "1" is the farthest distance from the Bus Stop and "3" the closest distance from the Bus Stop
where "1" is the farthest distance from the EV Charging Station and "3" the closest distance from the EV Charging Station
where "1" is the farthest distance from the Train Station and "3" the closest distance from the Train Station
where "1" is the farthest distance from the Underground Station and "3" the closest distance from the Underground Station
LOCATION
The Altitude Index describes the elevation of the property relative to sea level.
The internet signal index score is 720.
This index measures the overall quality of Internet Signal, where "1" is low and "3" is high.
The noise level index score is 55.
This index measures the overall quality of Noise Level, where "1" is low and "3" is high.
Distance from the property to the nearest Bar. Where "1" is the farthest, and "3" is the closest
Distance from the property to the nearest SeaSide where "1" is the farthest, and "3" is the closest
The Temperature Index measures the typical high and low outdoor temperatures experienced around a property.
Social & Community
The average income index score is 28000.
This index represents the social conditions of the area, where "1" is low and "3" is high.
Distance from the property to the nearest Church where "1" is the farthest, and "3" is the closest
Distance from the property to the nearest Community Engagement where "1" is the farthest, and "3" is the closest
The education level index score is 12.
This index represents the social conditions of the area, where "1" is low and "3" is high.
Distance from the property to the nearest Mosque where "1" is the farthest, and "3" is the closest
The population density index score is 8500.
This index represents the social conditions of the area, where "1" is low and "3" is high.
Distance from the property to the nearest Synagogue where "1" is the farthest, and "3" is the closest
Property Quality
The building age index score is 1935.
This index measures the overall quality of Building Age, where "1" is low and "3" is high.
The exterior index score is 600.
This index measures the overall quality of Exterior, where "1" is low and "3" is high.
The floor area area is 85.0 sq meters.
The index determines the Floor Area area of the property, where"1" is the farthest and "3" is the closest.
The interior index score is 550.
This index measures the overall quality of Interior, where "1" is low and "3" is high.
The kitchen area is 10.0 sq meters.
The index determines the Kitchen area of the property, where"1" is the farthest and "3" is the closest.
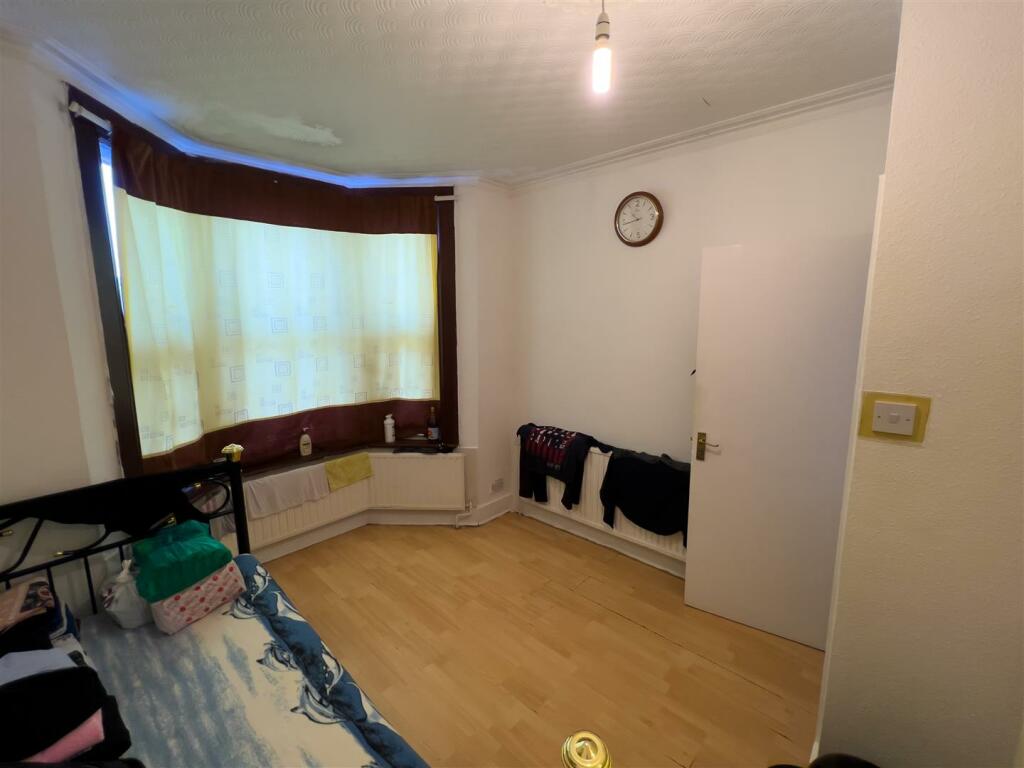
The living room area is 20.0 sq meters.
The index determines the Living Room area of the property, where"1" is the farthest and "3" is the closest.
The site area area is 120.0 sq meters.
The index determines the Site Area area of the property, where"1" is the farthest and "3" is the closest.
The view quality index score is 300.
This index measures the overall quality of View Quality, where "1" is low and "3" is high.
Sustainability & Safety
The air quality index score is 65.
This index measures the overall quality of Air Quality, where "1" is low and "3" is high.
The area safety index score is 45.
This index measures the overall quality of Area Safety, where "1" is low and "3" is high.
The energy consumption index score is 4500.
This index measures the overall quality of Energy Consumption, where "1" is low and "3" is high.
The energy efficiency index score is 55.
This index measures the overall quality of Energy Efficiency, where "1" is low and "3" is high.
The environmental impact index score is 1200.
This index measures the overall quality of Environmental Impact, where "1" is low and "3" is high.
Distance from the property to the nearest Fire Station. Where "1" is the farthest, and "3" is the closest
Distance from the property to the nearest Petrol Station where "1" is the farthest, and "3" is the closest
Distance from the property to the nearest Police Station. Where "1" is the farthest, and "3" is the closest
Market & Investment
The decade to decade growth index score is 45.00.
This index reflects market performance and investment potential, where "1" is low and "3" is high.
The half decade growth index score is 22.00.
This index reflects market performance and investment potential, where "1" is low and "3" is high.
The market liquidity index score is 60.
This index reflects market performance and investment potential, where "1" is low and "3" is high.
The price per meter square index score is 4412.
This index reflects market performance and investment potential, where "1" is low and "3" is high.
The roi potential index score is 7.
This index reflects market performance and investment potential, where "1" is low and "3" is high.
The undervaluation index score is 3.
This index reflects market performance and investment potential, where "1" is low and "3" is high.
The year to year growth index score is 4.50.
This index reflects market performance and investment potential, where "1" is low and "3" is high.
Development & Future Potential
The building condition index score is 600.
This index measures the overall quality of Building Condition, where "1" is low and "3" is high.
The construction ratio index score is 0.71.
This index measures the overall quality of Construction Ratio, where "1" is low and "3" is high.
The Improvement ROI Index measures how much financial return can be gained from improving or renovating the property.
The Permit Activity Index measures how active the area is in terms of granted building permits.
The renovation need index score is 350.
This index measures the overall quality of Renovation Need, where "1" is low and "3" is high.
The zoning flexibility index score is 400.
This index measures the overall quality of Zoning Flexibility, where "1" is low and "3" is high.
Comments
RADAR
AD
LOCATION
United Kingdom
Southall
UB2 5AS
AD
AD
AD
AD
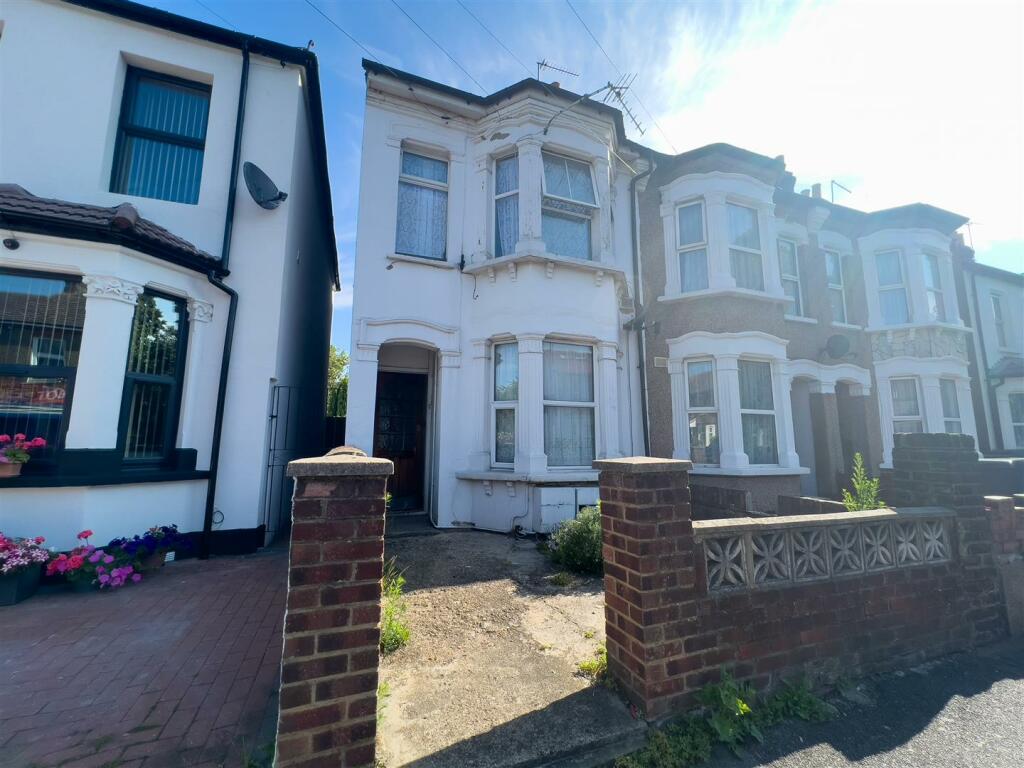
38 Dudley Road
 Southall, United Kingdom, UB2 5AS
RADAR
FEATURES
Number of Bedrooms
3
Number of Bathrooms
1
The total Internal Floor Area
85
Buy is Estimated Purchase Value
£375K
Rent is Estimated Rental Value per month
£1.3K
Stay is Estimated cost per night to stay in the property. This is used in websites such as Airbnb, Expedia, booking.com etc
£0
LIVING ROOM
KITCHEN
DINING ROOM
GARDEN
PARKING
BALCONY
SWIMMING POOL
ELEVATOR
AD
INDEX
Lifestyle & Amenities
The index determines the distance from the property to the nearest Bar, where "1" is the farthest, and "3" is the closest
The index determines the distance from the property to the nearest Cafe, Where "1" is the farthest, and "3" is the closest
Distance from the property to the nearest Convinience Store. Where "1" is the farthest, and "3" is the closest
Distance from the property to the nearest Gym. Where "1" is the farthest, and "3" is the closest
Distance from the property to the nearest Hospital. Where "1" is the farthest, and "3" is the closest
Distance from the property to the nearest Movie Theater. Where "1" is the farthest, and "3" is the closest
Distance from the property to the nearest Nursery. Where "1" is the farthest, and "3" is the closest
Distance from the property to the nearest Park. Where "1" is the farthest, and "3" is the closest
Distance from the property to the nearest Restaurant where "1" is the farthest, and "3" is the closest
Distance from the property to the nearest School where "1" is the farthest, and "3" is the closest
Distance from the property to the nearest Shopping Mall. Where "1" is the farthest, and "3" is the closest
Distance from the property to the nearest Supermarket where "1" is the farthest, and "3" is the closest
Accessibility & Transport
where "1" is the farthest distance from the Airport and "3" the closest distance from the Airport
where "1" is the farthest distance from the Bus Stop and "3" the closest distance from the Bus Stop
where "1" is the farthest distance from the EV Charging Station and "3" the closest distance from the EV Charging Station
where "1" is the farthest distance from the Train Station and "3" the closest distance from the Train Station
where "1" is the farthest distance from the Underground Station and "3" the closest distance from the Underground Station
LOCATION
The Altitude Index describes the elevation of the property relative to sea level.
The internet signal index score is 720.
This index measures the overall quality of Internet Signal, where "1" is low and "3" is high.
The noise level index score is 55.
This index measures the overall quality of Noise Level, where "1" is low and "3" is high.
Distance from the property to the nearest Bar. Where "1" is the farthest, and "3" is the closest
Distance from the property to the nearest SeaSide where "1" is the farthest, and "3" is the closest
The Temperature Index measures the typical high and low outdoor temperatures experienced around a property.
Social & Community
The average income index score is 28000.
This index represents the social conditions of the area, where "1" is low and "3" is high.
Distance from the property to the nearest Church where "1" is the farthest, and "3" is the closest
Distance from the property to the nearest Community Engagement where "1" is the farthest, and "3" is the closest
The education level index score is 12.
This index represents the social conditions of the area, where "1" is low and "3" is high.
Distance from the property to the nearest Mosque where "1" is the farthest, and "3" is the closest
The population density index score is 8500.
This index represents the social conditions of the area, where "1" is low and "3" is high.
Distance from the property to the nearest Synagogue where "1" is the farthest, and "3" is the closest
Property Quality
The building age index score is 1935.
This index measures the overall quality of Building Age, where "1" is low and "3" is high.
The exterior index score is 600.
This index measures the overall quality of Exterior, where "1" is low and "3" is high.
The floor area area is 85.0 sq meters.
The index determines the Floor Area area of the property, where"1" is the farthest and "3" is the closest.
The interior index score is 550.
This index measures the overall quality of Interior, where "1" is low and "3" is high.
The kitchen area is 10.0 sq meters.
The index determines the Kitchen area of the property, where"1" is the farthest and "3" is the closest.
The living room area is 20.0 sq meters.
The index determines the Living Room area of the property, where"1" is the farthest and "3" is the closest.
The site area area is 120.0 sq meters.
The index determines the Site Area area of the property, where"1" is the farthest and "3" is the closest.
The view quality index score is 300.
This index measures the overall quality of View Quality, where "1" is low and "3" is high.
Sustainability & Safety
The air quality index score is 65.
This index measures the overall quality of Air Quality, where "1" is low and "3" is high.
The area safety index score is 45.
This index measures the overall quality of Area Safety, where "1" is low and "3" is high.
The energy consumption index score is 4500.
This index measures the overall quality of Energy Consumption, where "1" is low and "3" is high.
The energy efficiency index score is 55.
This index measures the overall quality of Energy Efficiency, where "1" is low and "3" is high.
The environmental impact index score is 1200.
This index measures the overall quality of Environmental Impact, where "1" is low and "3" is high.
Distance from the property to the nearest Fire Station. Where "1" is the farthest, and "3" is the closest
Distance from the property to the nearest Petrol Station where "1" is the farthest, and "3" is the closest
Distance from the property to the nearest Police Station. Where "1" is the farthest, and "3" is the closest
Market & Investment
The decade to decade growth index score is 45.00.
This index reflects market performance and investment potential, where "1" is low and "3" is high.
The half decade growth index score is 22.00.
This index reflects market performance and investment potential, where "1" is low and "3" is high.
The market liquidity index score is 60.
This index reflects market performance and investment potential, where "1" is low and "3" is high.
The price per meter square index score is 4412.
This index reflects market performance and investment potential, where "1" is low and "3" is high.
The roi potential index score is 7.
This index reflects market performance and investment potential, where "1" is low and "3" is high.
The undervaluation index score is 3.
This index reflects market performance and investment potential, where "1" is low and "3" is high.
The year to year growth index score is 4.50.
This index reflects market performance and investment potential, where "1" is low and "3" is high.
Development & Future Potential
The building condition index score is 600.
This index measures the overall quality of Building Condition, where "1" is low and "3" is high.
The construction ratio index score is 0.71.
This index measures the overall quality of Construction Ratio, where "1" is low and "3" is high.
The Improvement ROI Index measures how much financial return can be gained from improving or renovating the property.
The Permit Activity Index measures how active the area is in terms of granted building permits.
The renovation need index score is 350.
This index measures the overall quality of Renovation Need, where "1" is low and "3" is high.
The zoning flexibility index score is 400.
This index measures the overall quality of Zoning Flexibility, where "1" is low and "3" is high.
INDEX