FEATURES
Number of Bedrooms
2
Number of Bathrooms
1
The total Internal Floor Area
65
Buy is Estimated Purchase Value
£430K
Rent is Estimated Rental Value per month
£1.4K
Stay is Estimated cost per night to stay in the property. This is used in websites such as Airbnb, Expedia, booking.com etc
-
LIVING ROOM

KITCHEN

DINING ROOM

GARDEN

PARKING

BALCONY

SWIMMING POOL

ELEVATOR

Lifestyle & Amenities
The index determines the distance from the property to the nearest Bar, where "1" is the farthest, and "3" is the closest
The index determines the distance from the property to the nearest Cafe, Where "1" is the farthest, and "3" is the closest
Distance from the property to the nearest Convinience Store. Where "1" is the farthest, and "3" is the closest
Distance from the property to the nearest Gym. Where "1" is the farthest, and "3" is the closest
Distance from the property to the nearest Hospital. Where "1" is the farthest, and "3" is the closest
Distance from the property to the nearest Movie Theater. Where "1" is the farthest, and "3" is the closest
Distance from the property to the nearest Nursery. Where "1" is the farthest, and "3" is the closest
Distance from the property to the nearest Park. Where "1" is the farthest, and "3" is the closest
Distance from the property to the nearest Restaurant where "1" is the farthest, and "3" is the closest
Distance from the property to the nearest School where "1" is the farthest, and "3" is the closest
Distance from the property to the nearest Shopping Mall. Where "1" is the farthest, and "3" is the closest
Distance from the property to the nearest Supermarket where "1" is the farthest, and "3" is the closest
Accessibility & Transport
where "1" is the farthest distance from the Airport and "3" the closest distance from the Airport
where "1" is the farthest distance from the Bus Stop and "3" the closest distance from the Bus Stop
where "1" is the farthest distance from the EV Charging Station and "3" the closest distance from the EV Charging Station
where "1" is the farthest distance from the Train Station and "3" the closest distance from the Train Station
where "1" is the farthest distance from the Underground Station and "3" the closest distance from the Underground Station
LOCATION
The Altitude Index describes the elevation of the property relative to sea level.
This index represents the long-term moisture conditions of the property’s location, where “1” indicates drier air conditions and “3” indicates higher average humidity levels throughout the year.
The Internet Signal Index measures the quality of mobile and broadband signal around the property.
The Noise Level Index describes how loud or quiet the surrounding environment is around a property.
This index represents the long-term precipitation conditions of the property’s location, where “1” indicates lower annual rainfall and “3” indicates higher yearly precipitation levels.
Distance from the property to the nearest Bar. Where "1" is the farthest, and "3" is the closest
Distance from the property to the nearest SeaSide where "1" is the farthest, and "3" is the closest
The Temperature Index measures the typical high and low outdoor temperatures experienced around a property.
This index represents the long-term wind conditions of the property’s location, where “1” indicates calmer wind levels and “3” indicates stronger average winds throughout the year.
Social & Community
This index represents the average income of people living in the surrounding area, where "1" indicates lower income and "3" indicates higher income.
Distance from the property to the nearest Church where "1" is the farthest, and "3" is the closest
This index reflects how socially active, connected, and community-driven the local area is, where "1" indicates lower levels of community involvement and social interaction and "3" indicates a highly engaged community with strong participation in local events, groups, and social activities.
This index represents the overall educational attainment of the surrounding community, where "1" indicates lower educational attainment and "3" indicates a more highly educated population.
Distance from the property to the nearest Mosque where "1" is the farthest, and "3" is the closest
This index represents how densely populated the surrounding area is, where "1" indicates a highly populated area and "3" indicates a sparsely populated area.
Distance from the property to the nearest Synagogue where "1" is the farthest, and "3" is the closest
Distance from the property to the nearest Temple where "1" is the farthest, and "3" is the closest
Property Quality
External quality of the property where "1" is the lowest External quality and "3" the highest External quality
The floor area area is 65.0 sq meters.
The index determines the Floor Area area of the property, where"1" is the compact and "3" is the spacious.
Internal quality of the property where "1" is the lowest Internal quality and "3" the highest internal quality
The size of the Kitchen where "1" is the smallest size and "3" the biggest
The size of the Living Room where "1" is the smallest size and 3 the biggest
The site area area is 90.0 sq meters.
The index determines the Site Area area of the property, where"1" is the compact and "3" is the spacious.
View quality of the property where "1" is the lowest View quality and "3" the highest View quality
Sustainability & Safety
It describes how clean or polluted the air is, and what health effects that pollution might have on people. The lower the index the worse the air quality and the greater the potential health concern.
The Area Safety Index measures how safe a property’s neighborhood is based on crime statistics and security indicators.
Current estimated total energy consumption for the property in a 12 month period (kWh/m2). Displayed on EPC as the current primary energy use per square metre of floor area.
The energy efficiency of the property is 60, based on its EPC score.
This index reflects the property's overall energy performance, where "1" is low and "3" is high.
The property's estimated annual environmental impact is 52 kg CO₂ emissions.
This index reflects the environmental footprint derived from energy consumption, where "1" is high and "3" is low CO₂ Emissions.
Distance from the property to the nearest Fire Station. Where "1" is the farthest, and "3" is the closest
Distance from the property to the nearest Petrol Station where "1" is the farthest, and "3" is the closest
Distance from the property to the nearest Police Station. Where "1" is the farthest, and "3" is the closest
Market & Investment
The Decade-to-Decade Growth Index measures long-term price growth trends for the area surrounding a property.
This index represents the population or development growth in the surrounding area over the past five years, where "1" indicates slower or minimal growth and "3" indicates fast or significant growth.
The Market Liquidity Index measures how quickly properties sell in the surrounding area.
The Price per m² Index measures how expensive or affordable a property is relative to its size.
The ROI Potential Index measures the expected return on investment a property may generate based on local demand, pricing trends, and asset fundamentals.
The Undervaluation Index measures how underpriced a property is compared to similar properties in the same market.
Year-to-year property price growth in the surrounding area.
Where "1" indicates the lowest annual growth, and "3" indicates the highest annual growth.
Development & Future Potential
The Building Condition Index measures the overall physical condition of a property.
The Construction Ratio (FAR) Index measures the Floor Area Ratio (built area vs land area) around the property.
The Improvement ROI Index measures how much financial return can be gained from improving or renovating the property.
The Permit Activity Index measures how active the area is in terms of granted building permits.
The Renovation Need Index measures how much renovation a property is likely to require.
The Zoning Flexibility Index measures how flexible the local zoning rules are for modifying or expanding the property.
Comments
RADAR
LOCATION
United Kingdom
Overall score of 84 out of 100
Reason: The UK offers strong safety, robust infrastructure, and high-quality public services. Healthcare and transportation are advanced, though housing affordability and environmental concerns persist. Overall, it is highly attractive for residential living with few significant weaknesses.
East Ham
Overall score of Neighbourhood is 58 out of 100
Reason: East Ham offers good connectivity and reasonable amenities with moderate safety and community quality. However, it has lower prestige and architectural consistency compared to central London areas, impacting overall residential appeal.
E15 1JD
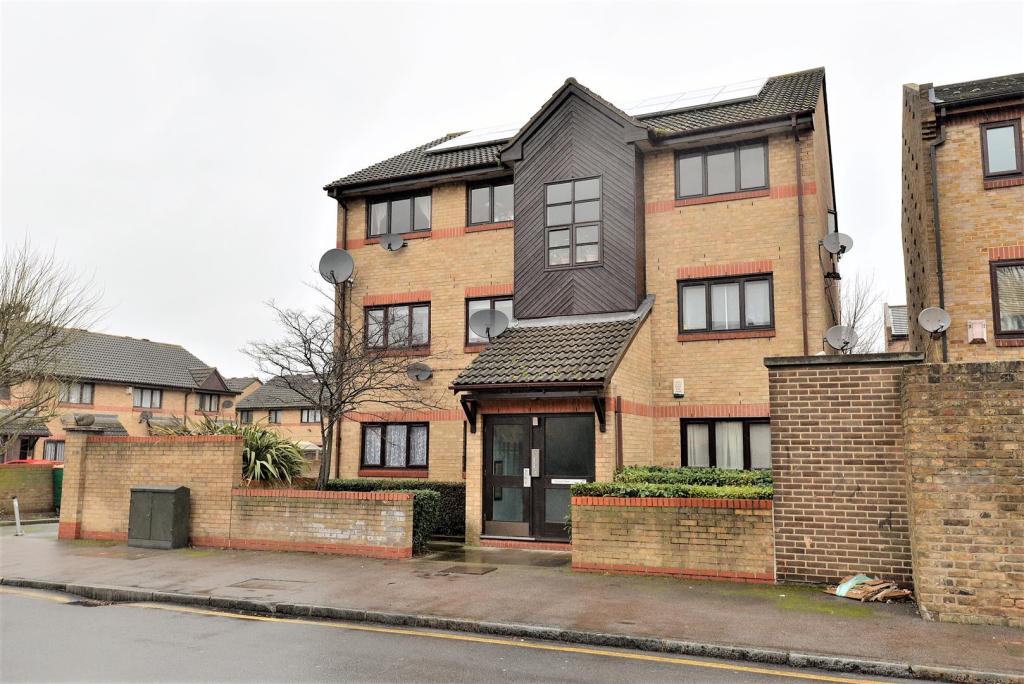
98 Maryland Street
 London, United Kingdom, E15 1JD
RADAR
FEATURES
Number of Bedrooms
2
Number of Bathrooms
1
The total Internal Floor Area
65
Buy is Estimated Purchase Value
£430K
Rent is Estimated Rental Value per month
£1.4K
Stay is Estimated cost per night to stay in the property. This is used in websites such as Airbnb, Expedia, booking.com etc
-
LIVING ROOM
KITCHEN
DINING ROOM
GARDEN
PARKING
BALCONY
SWIMMING POOL
ELEVATOR
INDEX
Lifestyle & Amenities
The index determines the distance from the property to the nearest Bar, where "1" is the farthest, and "3" is the closest
The index determines the distance from the property to the nearest Cafe, Where "1" is the farthest, and "3" is the closest
Distance from the property to the nearest Convinience Store. Where "1" is the farthest, and "3" is the closest
Distance from the property to the nearest Gym. Where "1" is the farthest, and "3" is the closest
Distance from the property to the nearest Hospital. Where "1" is the farthest, and "3" is the closest
Distance from the property to the nearest Movie Theater. Where "1" is the farthest, and "3" is the closest
Distance from the property to the nearest Nursery. Where "1" is the farthest, and "3" is the closest
Distance from the property to the nearest Park. Where "1" is the farthest, and "3" is the closest
Distance from the property to the nearest Restaurant where "1" is the farthest, and "3" is the closest
Distance from the property to the nearest School where "1" is the farthest, and "3" is the closest
Distance from the property to the nearest Shopping Mall. Where "1" is the farthest, and "3" is the closest
Distance from the property to the nearest Supermarket where "1" is the farthest, and "3" is the closest
Accessibility & Transport
where "1" is the farthest distance from the Airport and "3" the closest distance from the Airport
where "1" is the farthest distance from the Bus Stop and "3" the closest distance from the Bus Stop
where "1" is the farthest distance from the EV Charging Station and "3" the closest distance from the EV Charging Station
where "1" is the farthest distance from the Train Station and "3" the closest distance from the Train Station
where "1" is the farthest distance from the Underground Station and "3" the closest distance from the Underground Station
LOCATION
The Altitude Index describes the elevation of the property relative to sea level.
This index represents the long-term moisture conditions of the property’s location, where “1” indicates drier air conditions and “3” indicates higher average humidity levels throughout the year.
The Internet Signal Index measures the quality of mobile and broadband signal around the property.
The Noise Level Index describes how loud or quiet the surrounding environment is around a property.
This index represents the long-term precipitation conditions of the property’s location, where “1” indicates lower annual rainfall and “3” indicates higher yearly precipitation levels.
Distance from the property to the nearest Bar. Where "1" is the farthest, and "3" is the closest
Distance from the property to the nearest SeaSide where "1" is the farthest, and "3" is the closest
The Temperature Index measures the typical high and low outdoor temperatures experienced around a property.
This index represents the long-term wind conditions of the property’s location, where “1” indicates calmer wind levels and “3” indicates stronger average winds throughout the year.
Social & Community
This index represents the average income of people living in the surrounding area, where "1" indicates lower income and "3" indicates higher income.
Distance from the property to the nearest Church where "1" is the farthest, and "3" is the closest
This index reflects how socially active, connected, and community-driven the local area is, where "1" indicates lower levels of community involvement and social interaction and "3" indicates a highly engaged community with strong participation in local events, groups, and social activities.
This index represents the overall educational attainment of the surrounding community, where "1" indicates lower educational attainment and "3" indicates a more highly educated population.
Distance from the property to the nearest Mosque where "1" is the farthest, and "3" is the closest
This index represents how densely populated the surrounding area is, where "1" indicates a highly populated area and "3" indicates a sparsely populated area.
Distance from the property to the nearest Synagogue where "1" is the farthest, and "3" is the closest
Distance from the property to the nearest Temple where "1" is the farthest, and "3" is the closest
Property Quality
External quality of the property where "1" is the lowest External quality and "3" the highest External quality
The floor area area is 65.0 sq meters.
The index determines the Floor Area area of the property, where"1" is the compact and "3" is the spacious.
Internal quality of the property where "1" is the lowest Internal quality and "3" the highest internal quality
The size of the Kitchen where "1" is the smallest size and "3" the biggest
The size of the Living Room where "1" is the smallest size and 3 the biggest
The site area area is 90.0 sq meters.
The index determines the Site Area area of the property, where"1" is the compact and "3" is the spacious.
View quality of the property where "1" is the lowest View quality and "3" the highest View quality
Sustainability & Safety
It describes how clean or polluted the air is, and what health effects that pollution might have on people. The lower the index the worse the air quality and the greater the potential health concern.
The Area Safety Index measures how safe a property’s neighborhood is based on crime statistics and security indicators.
Current estimated total energy consumption for the property in a 12 month period (kWh/m2). Displayed on EPC as the current primary energy use per square metre of floor area.
The energy efficiency of the property is 60, based on its EPC score.
This index reflects the property's overall energy performance, where "1" is low and "3" is high.
The property's estimated annual environmental impact is 52 kg CO₂ emissions.
This index reflects the environmental footprint derived from energy consumption, where "1" is high and "3" is low CO₂ Emissions.
Distance from the property to the nearest Fire Station. Where "1" is the farthest, and "3" is the closest
Distance from the property to the nearest Petrol Station where "1" is the farthest, and "3" is the closest
Distance from the property to the nearest Police Station. Where "1" is the farthest, and "3" is the closest
Market & Investment
The Decade-to-Decade Growth Index measures long-term price growth trends for the area surrounding a property.
This index represents the population or development growth in the surrounding area over the past five years, where "1" indicates slower or minimal growth and "3" indicates fast or significant growth.
The Market Liquidity Index measures how quickly properties sell in the surrounding area.
The Price per m² Index measures how expensive or affordable a property is relative to its size.
The ROI Potential Index measures the expected return on investment a property may generate based on local demand, pricing trends, and asset fundamentals.
The Undervaluation Index measures how underpriced a property is compared to similar properties in the same market.
Year-to-year property price growth in the surrounding area.
Where "1" indicates the lowest annual growth, and "3" indicates the highest annual growth.
Development & Future Potential
The Building Condition Index measures the overall physical condition of a property.
The Construction Ratio (FAR) Index measures the Floor Area Ratio (built area vs land area) around the property.
The Improvement ROI Index measures how much financial return can be gained from improving or renovating the property.
The Permit Activity Index measures how active the area is in terms of granted building permits.
The Renovation Need Index measures how much renovation a property is likely to require.
The Zoning Flexibility Index measures how flexible the local zoning rules are for modifying or expanding the property.
LOCATION
United Kingdom
Overall score of 84 out of 100
Reason: The UK offers strong safety, robust infrastructure, and high-quality public services. Healthcare and transportation are advanced, though housing affordability and environmental concerns persist. Overall, it is highly attractive for residential living with few significant weaknesses.
East Ham
Overall score of NeighbourhoodRating is 58 out of 100
Reason: East Ham offers good connectivity and reasonable amenities with moderate safety and community quality. However, it has lower prestige and architectural consistency compared to central London areas, impacting overall residential appeal.
INDEX